You are using an out of date browser. It may not display this or other websites correctly.
You should upgrade or use an alternative browser.
You should upgrade or use an alternative browser.
Throttle position sensor
- Thread starter cope1980
- Start date
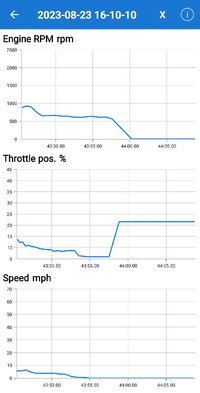
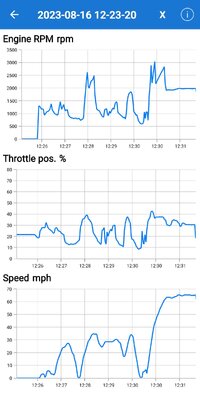
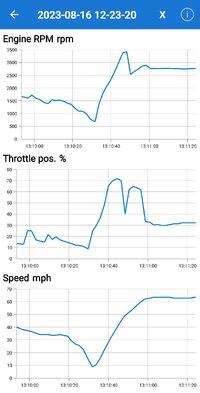
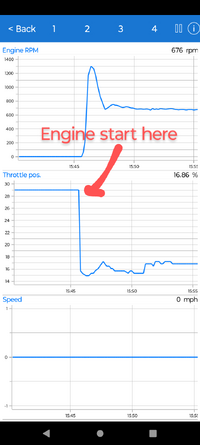
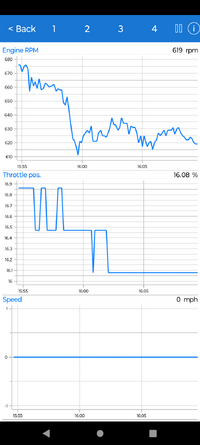
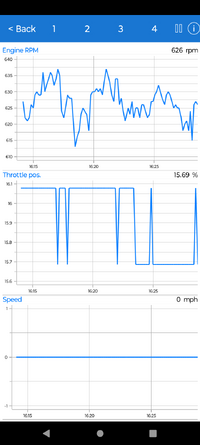
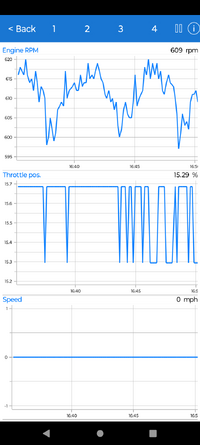
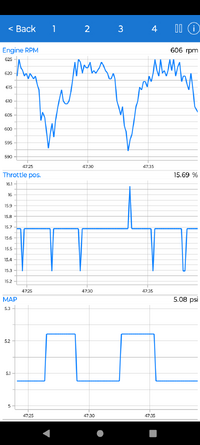
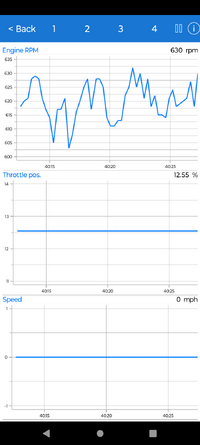
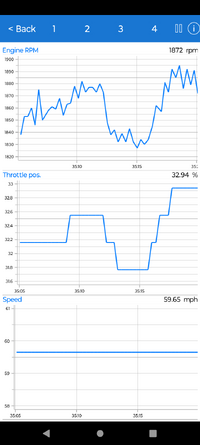
Taken from this, it appears that your TP is "rock solid" at engine off (first three charts). Then the OP appears to have some electrical (poor connect?) / mechanical problem (looseness).... maybeI have these on file. I can make more specific readings also.
View attachment 109738View attachment 109739View attachment 109740
Taken from this, it appears that your TP is "rock solid" at engine off (first three charts). Then the OP appears to have some electrical (poor connect?) / mechanical problem (looseness).... maybe
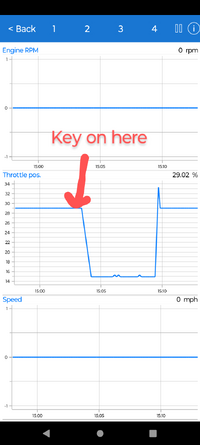
I will try to get a read today at engine cold, key on, engine off for an ample duration.
I might not be able to get Car Scanner to graph right from the key on as the app requires a reply from the PCM before it initializes. But there is a chance I can work around that.
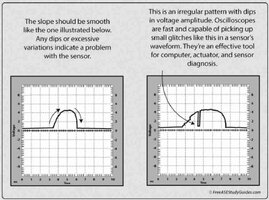
Because in general, the variable actions of the TPS and APP functions can be infinite... what you will actually be looking for is a Pattern that Displays a Momentary *Glitch* or a sudden SIGNAL DROP OUT using the ONLY Device capable of catching such transient deviations: An Oscilloscope ...as illustrated below.
The Other Thing to investigate on your Scan Tool is the Throttle Plate Angle ...after looking the Throttle Body and Harnessing over ...and for any Electro-Mechanical Defect in the TPS Throttle Motor by virtue of it not achieving a smooth and variable Opening or Closing Status; perhaps caused by Rodents Chewing on the Harness and Connector(s). The Throttle Body on the GM Atlas Vortec 4200 Engine is NOT a Serviceable Module:
 gmtnation.com
The Other Thing to investigate on your Scan Tool is the Throttle Plate Angle ...after looking the Throttle Body and Harnessing over ...and for any Electro-Mechanical Defect in the TPS Throttle Motor by virtue of it not achieving a smooth and variable Opening or Closing Status; perhaps caused by Rodents Chewing on the Harness and Connector(s). The Throttle Body on the GM Atlas Vortec 4200 Engine is NOT a Serviceable Module:

How To Use PICO #2204A & HANTEK #1008C Oscilloscopes
You don't need a Huge Bag of Coins in order to obtain and use an Oscilloscope for performing In-Depth Wave Form Analysis in Automotive Applications on everything from Problematic Electronic Fuel Injection to obtaining accurate Compression Tests to Diagnose Internal Engine Conditions. HANTEK...
Last edited:
Key on, engine off
So it looks like your throttle is consistantly a tad high. Is your throttle body filthy? What are the MAP readings like at idle? I don't know if that would make a difference, just reaching here for a reason for the throttles to be elevated.
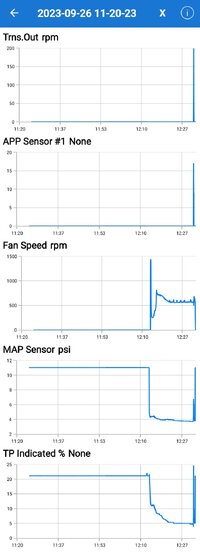
Here are some of mine from yesterday....
Here the truck sat at key on engine off for like 40 minutes before starting. Throttle position was stable for that duration before starting. Vehicle was allowed to warm up at idle for near 20 minutes. No accelerator pedal action for the startup/warmup. The throttle got as low as 4.65% when the warmup was complete.
Unrelated but I caught one of those instances when my EV Fan clutch apparently had no fluid in the working chamber and as such was very slow for a minute or so.
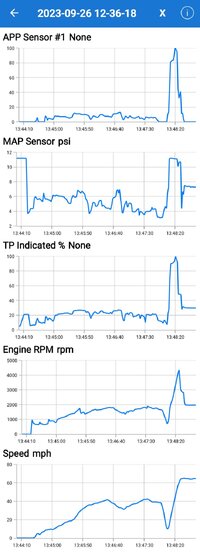
This one shows a range of operation including a pretty strong pull which I practically never do.
And lastly the end of a drive where it is seen the throttle is about 5% at idle.
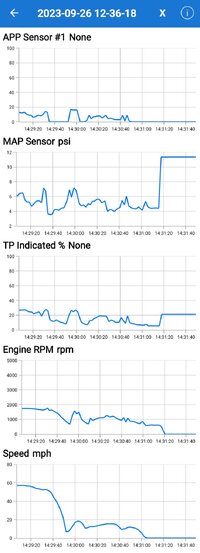
What does this all mean? I have no idea other than your throttle seems to be higher than mine.
...in a related Thread... Consider this a "Fish-Bite" Throttle at Idle issue... as demonstrated by your RPM Graph in Post #7:
 gmtnation.com
Envoy with dreaded rough idle, no codes, UPDATE FIXED!
Another Envoy with the dreaded rough idle. 04 with 200k, been a great truck, maintained well, no major issues. No Codes Having an issue with a rough idle condition, goes away at about 700 rpm. Accelerates fine and top end is fine. Just a pronounced misfire at about 500 rpm. Actions taken...
Normal PWM (Pulse Width Modulation for a Hall Effect Square Wave Sensor) should have clean "Squared Off" Rectangular shapes and not display any that have any "Peak to a Point" aspects, like some of the ones in your Graphing Images display. This group of comprehensive Tests might give you another avenue to investigate. Don't skip around or pick and choose just any of the Tests displayed on all Three Pages. Be very systematic with your DMM and Probes and record everything *** with these for Best Results:
 troubleshootmyvehicle.com
*** Take Notes and Still Camera Shots of the DMM Screens as Testing Things produce results.
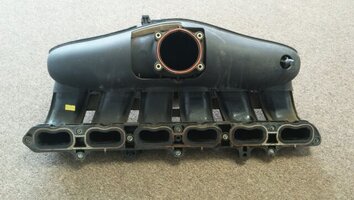
On the outside chance that you are getting transient vacuum issues around the perimeter of the Intake Manifold allowing un-metered (unmeasured) air to get ingested... try CAREFULLY re-tightening the 10 Perimeter IM Flange bolts back down to a mere 89 Inch Pounds ...and NO MORE. ...and then run the same test of the Throttle Body Position vs. Engine Idle RPM again to see if this action affects the Engine Idle in any way and alter the "Fish-Bite" Pattern at Idle.
This is a Good Primer for the concepts involved here ...with discreet explanations:
Electronic Throttle Body Tests (2002-2007 4.2L Chevrolet TrailBlazer)
*** Take Notes and Still Camera Shots of the DMM Screens as Testing Things produce results.
On the outside chance that you are getting transient vacuum issues around the perimeter of the Intake Manifold allowing un-metered (unmeasured) air to get ingested... try CAREFULLY re-tightening the 10 Perimeter IM Flange bolts back down to a mere 89 Inch Pounds ...and NO MORE. ...and then run the same test of the Throttle Body Position vs. Engine Idle RPM again to see if this action affects the Engine Idle in any way and alter the "Fish-Bite" Pattern at Idle.

This is a Good Primer for the concepts involved here ...with discreet explanations:
Last edited:
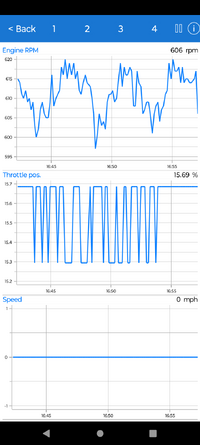
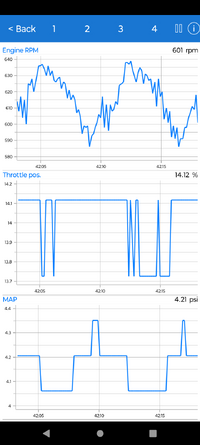
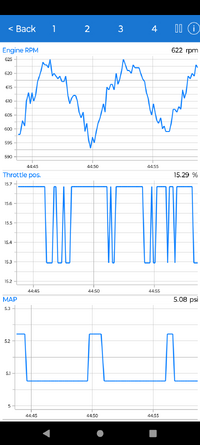
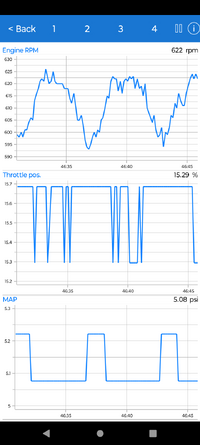
I caught this anomaly
I don't think I am seeing any anomoly here. What I am seeing are fluctuations caused by the conversion of analog voltages to digital values. Your graphs are simply zoomed in way too far.
Let's take the throttle position for example. It looks to be spiking up and down. However, on close inspection these spikes are roughly just 0.4%. Not enough variance to cause much of anything.
The throttle position has a range of 0% to 100%. A single byte has a range of 0 to 255. So to represent the throttle position with a single byte each bit is 100/255 = 0.392%.
So that "spike" in the throttle graph is the minimum value a change can be, one single bit.
Similar for the MAP sensor. The MAP sensor value is reported by the PCM in kPa. To convert to psi it is multiplied by 0.145038. So the minimum change in psi is 0.145.
The graphs will look like they are jumping about when zoomed in too far.
I think what I am seeing in the first set of graphs may be this...
The engine idle RPM drifts higher in response to something like an intake manifold leak. The PCM sees the idle speed going higher than the desired idle speed and tries closing the throttle a very small amount. This causes the throttle position displayed in the graph to fluctuate as the digitized value approaches a rounding point in the equations as the throttle position just barely reduces. The closing throttle lowers the MAP value and a similar artifact of the equation for the MAP sensor causes the drop seen in that graph.
I think I might look for a intake manifold leak or mybe a leaking EVAP purge valve or the like? Just a thought.
One additional advantage worth mentioning when comparing the use of a Standard Digital Multi Meter vs. using say a Basic 8-12 Bit Sample Rate of a Pico-Scope Model# 2204A Oscilloscope is that the Sample Rates being recorded by Typical, Non-Graphing DMMs is AVERAGED... while the sample rate (per second...or LESS) of any decent, inexpensive Oscilloscope will be in the MILLIONS per Second. Even a moderately priced Oscilloscope can have a Gigabit Per Second Sample Rate as well.
I don't use any of the Torque Apps on a Cell Phone which is the apparent source of all the Graphs provided so far ... BUT... if the Sample Rate Per Second is Too Low... the "Shapes" of the Graph might not be as accurate...and therefore... be misleading. More information on this from Torque Users would be helpful. This is a fairly Technical... BUT ...Very Important Distinction needed to understand WHY using an Automotive Oscilloscope can help with Fine Grain Automotive Module Diagnostics:
I don't use any of the Torque Apps on a Cell Phone which is the apparent source of all the Graphs provided so far ... BUT... if the Sample Rate Per Second is Too Low... the "Shapes" of the Graph might not be as accurate...and therefore... be misleading. More information on this from Torque Users would be helpful. This is a fairly Technical... BUT ...Very Important Distinction needed to understand WHY using an Automotive Oscilloscope can help with Fine Grain Automotive Module Diagnostics:
Last edited:

